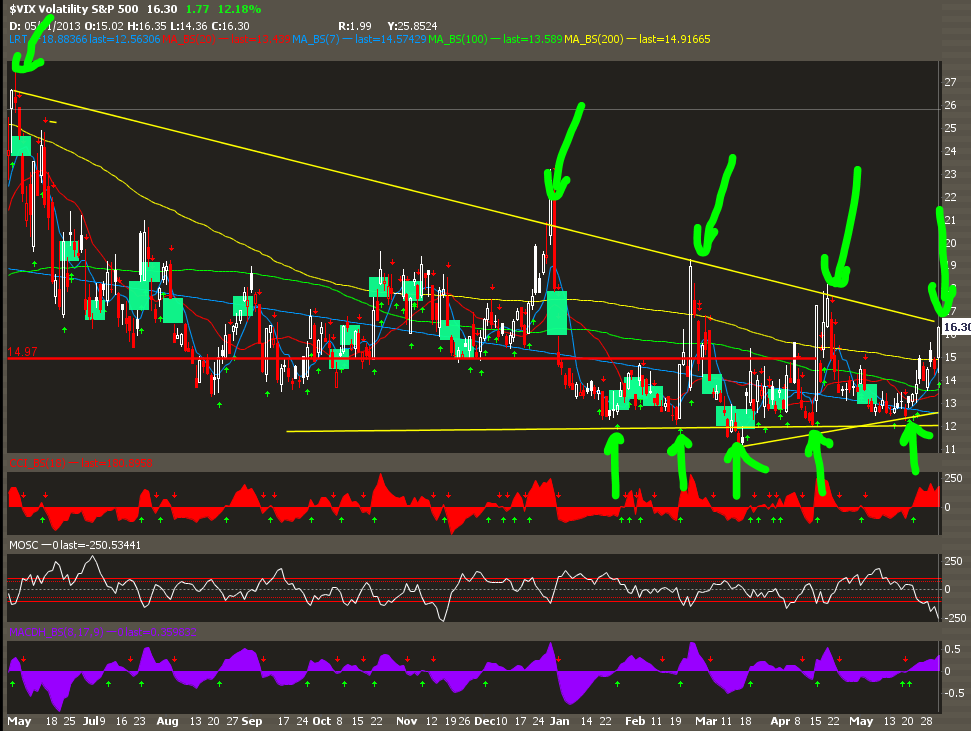
| 12 months chart: VIX has tried to break out and failed 5 times. BUT, they also tried to break it down and it bounced solidly off the 12level. Just like a high jumper, give it enough tries he/she will be able to clear the hurdle. In this case, the VIX with a solid footing may be able to break out (bearish the market) from this descending trend. See the lower chart for some more perspective of how high can it go... |
 |
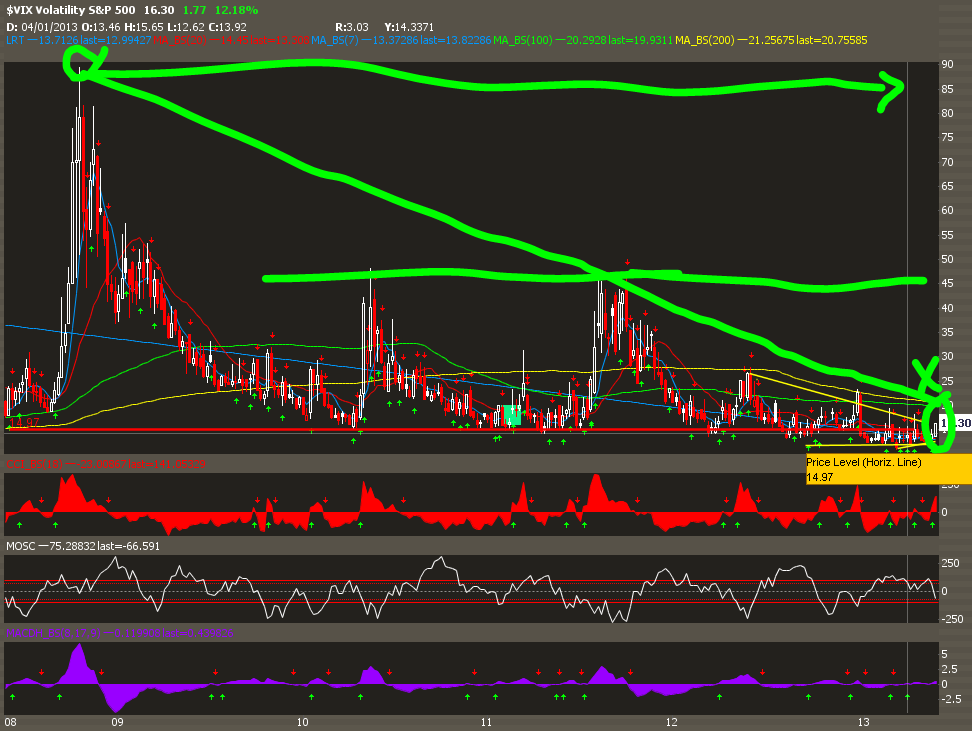
| 5year Chart: So how high can it go? VERY HIGH ;-) Furthermore, I see the same footing level and lower highs. To me, this is the VIX tightening and could be winding for a big move. At X, the tighter the range could indicate a potential big move. Though the direction is unknown, the likelihood is UP (bearish) since the 5 year footing has prevailed. |
 |
Friday, May 31, 2013
$VIX Perspective
Here is some perspective on the VIX. Below are 2
charts with my CRAYON based opinion. Often enough, the CRAYON is the simplest
way of looking at trends. You have my permission to make fun of my
drawing skills ;-)